OBJECTIVE 8 | THE DASHBOARD

Increase BIPOC Leadership Across the Food System

Indicator

Total Members of the U.S. House and Senate

Does the United States Congress represent the racial, ethnic, and gender diversity of America?

No, about 95% of total Representatives or Senators in U.S. history have been White men.

About the data

Source: United States House of Representatives

Last updated: 2021

Indicator

San Diego County Board of Supervisors

Does the San Diego County Board of Supervisors represent the racial, ethnic, and gender diversity of the region?

No, 89% of San Diego County Supervisors have been White men.

About the data

Source: San Diego County Board of Supervisors.

Last updated: 2021

Indicator

U.S. and California Business Ownership by Race/Ethnicity

Does private sector business ownership in the United States reflect the diversity of the country?

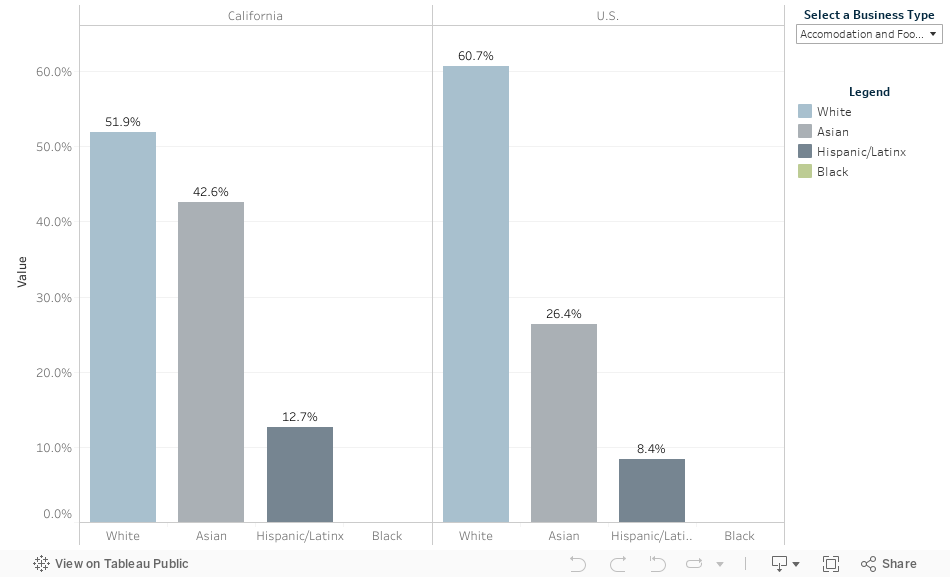
No, business ownership across the country is divided along racial lines. Nationally, 77% of businesses are White-owned, 10% are Asian-owned, 6% are Hispanic/Latinx-owned, and 2% are Black-owned. Compared to the national average, California has greater diversity in business ownership among Asian and Hispanic/Latinx communties, but lower business ownership among Black communities. Accommodation and Food Services, a category that includes hotels, restaurants, fast food, and bars, accounts for 9% of U.S. and California businesses. Nationally, the majority of Accommodation and Food Services businesses are owned by White Americans. California has a greater diversity of Asian and Hispanic/Latinx ownership of Accommodation and Food Services businesses.

About the data

Source: U.S. Census Bureau, 2019 Annual Business Survey

Last updated: 2019

Note: Values for Black business owners were not disclosed for Accommodation and Food Services.

Indicator

The Forbes 400 Wealthiest Americans in 2020

Does wealth concentration reflect the diversity of American society?

No, 323 (81%) of the wealthiest Americans are White men. Fifty (12.5%) of the wealthiest Americans are White women.

About the data

Source: Forbes 400

Last updated: 2020

Indicator

San Diego County Farmer Race/Ethnicity Demographics

Is the diversity of San Diego County farmers increasing?

No, the vast majority of farms and land in agriculture in California and San Diego County are operated by White producers for all available years of the Census of Agriculture (note that we only depict 4 years). San Diego County has the most relatively diverse producers of any county in California.

About the data

Source: USDA Census of Agriculture

Last updated: 2017

Indicator

BIPOC Makeup of Food System Boards of Directors and Executive Leadership

Do nonprofit boards of directors and executive leadership reflect the diversity of San Diego County?

No. The Nonprofit Institute at the University of San Diego conducts an annual assessment of nonprofit organizations in San Diego County. There are nearly 12,000 nonprofit organizations in San Diego County today, compared to 5,100 in 1995. Leadership positions in San Diego County nonprofits are not representative of the racial/ethnic diversity of the region: 32% of leadership teams, 24% of CEOs, 33% of board members, and 25% of board chairs identified as BIPOC, compared to 55% of county residents. The San Diego Food System Alliance reviewed the leadership and board make-up of 28 food system-related nonprofits and two educational institutions with heavy food system connections in San Diego County. We found that 14 out of 30 (47%) organizations had BIPOC executive directors and 24 out of 30 (80%) had female executive directors. Twenty of the 30 organizations had boards of directors or advisory boards. These 20 organizations had 170 total board members and 51 (30%) were BIPOC.

About the data

Source: Total nonprofits: University of San Diego Nonprofit Institute. Food system nonprofits: San Diego Food System Alliance

Last updated: 2021