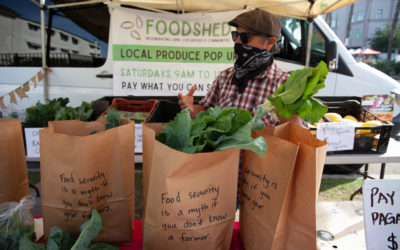
OBJECTIVE 6 | THE DASHBOARD

Improve Community Food Environments

Indicator

U.S. Food Sales for Consumption at Home and Away From Home

Where do Americans buy food? Are sales increasing?

Yes, sales have increased over the past 20 years and Americans increasingly buy food for consumption away from home (e.g., restaurants, fast food).

About the data

Source: USDA Economic Research Service

Last updated: 2019

Note: Adjusted for inflation to 2019 dollars.

Indicator

U.S. Food Sales for Consumption Away From Home

Are food sales for consumption away from home increasing?

Yes, consumption patterns have shifted so that more Americans are eating away from home than at home. The majority of sales are at limited-service restaurants (e.g., fast food) and full-service restaurants.

About the data

Source: USDA Economic Research Service

Last updated: 2019

Note: Adjusted for inflation to 2019 dollars.

Indicator

U.S. Food Sales for Consumption At Home

Are food sales for consumption at home increasing?

Yes, food sales for consumption at home have increased over the past 20 years, largely driven by increased purchases at warehouse clubs and supercenters like Costco.

About the data

Source: USDA Economic Research Service

Last updated: 2019

Note: Adjusted for inflation to 2019 dollars.

Indicator

Value of San Diego County Retail Food Sales

Are San Diego County retail food sales increasing?

Yes, retail food sales increased 31% ($4.1 billion) from 2012 to 2017. Grocery stores, restaurants, and fast food account for the majority of sales.

About the data

Source: U.S. Census Bureau, Economic Census

Last updated: 2017

Note: Adjusted for inflation to 2019 dollars.

Indicator

Adults That Have Obesity by Race/Ethnicity by Region

Are rates of adults that have obesity increasing? Does the percentage of San Diego County adults that have obesity differ by race/ethnicity?

Yes, the percentage of Black and Hispanic/Latinx adult San Diegans with obesity is higher than for White and Asian San Diegans.

About the data

Source: U.S. data: Centers for Disease Control and Prevention, 2019, Nutrition, Physical Activity, and Obesity. San Diego County data: California Health Interview Survey.

Last updated: 2019

Note: Nearly all CHIS data values for Asian San Diegans and many of the values for Black San Diegans are considered “statistically unstable.” Values for Indigenous San Diegans were too unstable to use.

Indicator

Death from Diabetes by Race/Ethnicity and Region in San Diego County

Are rates of adults with diabetes increasing? Does the percentage of San Diego County adults with diabetes differ by race/ethnicity and region?

Yes, the rates of death from diabetes disproportionately impact Indigenous and Black communities in San Diego County. Rates are particularly high in the Central Region, including Central San Diego, Mid-City, and Southeastern San Diego, the East Region, including El Cajon, La Mesa, and Lemon Grove, and the South Region, including Chula Vista and National City.

About the data

Source: County of San Diego, Chronic Disease Dashboard, 2018.

Last updated: 2018