OBJECTIVE 9 | THE DASHBOARD

Build a Movement that Uplifts a Local, Sustainable, and Equitable Food System

Indicator

“Local Food” Google Trends

Is interest in “local food” increasing in the United States? Is interest in “local food” increasing in San Diego County?

Yes, Google trends indicate that interest in local food has increased steadily over the past 20 years in the United States. However, we see limited interest through Google Trends in San Diego County.

About the data

Source: Google Trends

Last updated: June 1, 2021

Note: Numbers represent search interest relative to the highest point on the chart for the given region and time. A value of 100 is the peak popularity for the term. A value of 50 means that the term is half as popular. A score of 0 means there was not enough data for this term.

Indicator

“Food Security” Google Trends

Is interest in “food security” increasing in the United States? Is interest in “food security” increasing in San Diego County?

Yes, Google Trends indicate that interest in food security has increased over the past 20 years in the United States, with the highest interest during the Great Recession in 2009. However, we see limited interest through Google Trends in San Diego County.

About the data

Source: Google Trends

Last updated: June 1, 2021

Note: Numbers represent search interest relative to the highest point on the chart for the given region and time. A value of 100 is the peak popularity for the term. A value of 50 means that the term is half as popular. A score of 0 means there was not enough data for this term.

Indicator

“Food is Medicine” Google Trends

Is interest in “food is medicine” increasing in the United States?

Yes, Google Trends indicate that interest in “food is medicine” has increased over the past 20 years in the United States. Data for San Diego County was unavailable.

About the data

Source: Google Trends

Last updated: June 1, 2021

Note: Numbers represent search interest relative to the highest point on the chart for the given region and time. A value of 100 is the peak popularity for the term. A value of 50 means that the term is half as popular. A score of 0 means there was not enough data for this term.

Indicator

“Regenerative Agriculture” Google Trends

Is interest in “regenerative agriculture” increasing in the United States?

Yes, Google Trends indicate that interest in “regenerative agriculture” has increased over the past 20 years in the United States. Data for San Diego County was unavailable.

About the data

Source: Google Trends

Last updated: June 1, 2021

Note: Data for San Diego was unavailable. Numbers represent search interest relative to the highest point on the chart for the given region and time. A value of 100 is the peak popularity for the term. A value of 50 means that the term is half as popular. A score of 0 means there was not enough data for this term.

Indicator

San Diego County Direct Sales

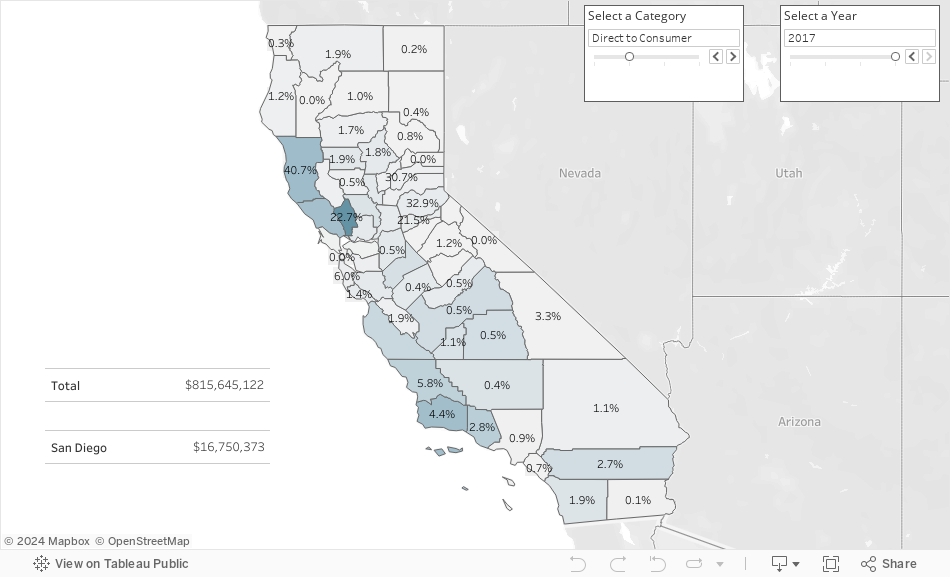
Are direct sales from San Diego County farmers to consumers increasing?

The estimates for direct sales present a mixed picture. San Diego County’s direct to consumer sales (e.g., through farmers markets, farm stands, and CSAs) were relatively modest in 2007, 2012, and 2017. Direct to retail sales, a new category introduced in 2017, were relatively strong in San Diego County – over $50 million in sales. Another new category, the value of processed or value-added agricultural products sold, represents the value of products that originated on farms that are transformed into products worth more than the raw product. This new category is most clearly evident in Napa County, where the value of wine production far exceeds the value of the original grapes. The value of processed or value-added products in San Diego County is modest—$14 million.

About the data

Source: USDA Census of Agriculture

Last updated: June 1, 2021

Note: Adjusted for inflation to 2019 dollars. For the 2017 Census of Agriculture the USDA modified how it collected direct sales data and they say that caution should be used when comparing 2017 to 2012 and 2007.